Blog
Insights
What Drives Imports and Exports of Bulk Wine?
Hereby with the help of the graph and research analytics, you will get the idea about the import and export business of bulk wine.
Georgi’s Conclusion
Exchange rates are part of the explanation. There are other things that influence the wine trade: yields, demand changes, policy (duty drawbacks)
Theory and Reality: Bulk wine 2011-2014 A strong dollar
- Increases volume of imports and
- Lowers the U.S. dollar price of imports
- Reduces the volume of U.S. Exports and
- Raises prices of U.S Exports for foreign buyers in their currencies
Between 2011 and 2014 the dollar gained about 15.5% against currencies of most wine producing countries (weighted by the value of imports). The dollar gained about 7.5% against the currencies of major wine importing countries (Euro, Pound, Yen, Yuan, HK Dollar) • What happened to U.S. Imports and Exports of bulk wine?
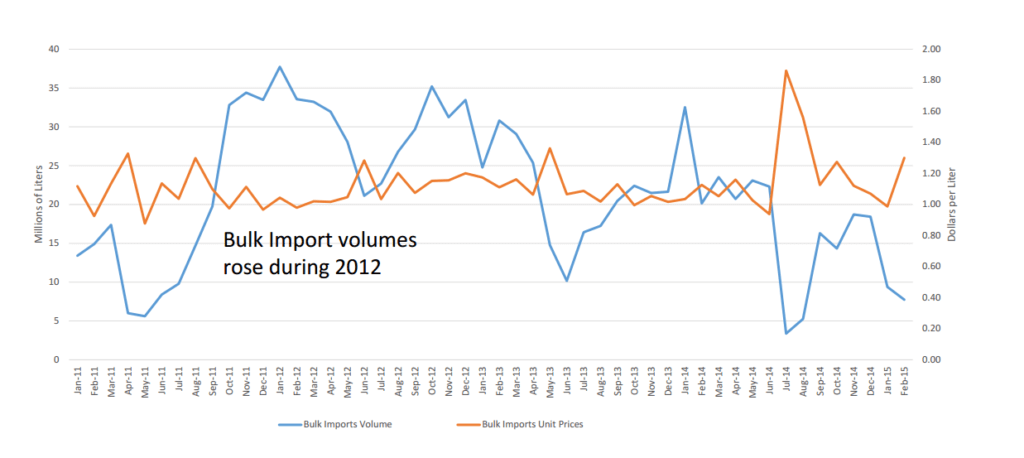
U.S. Total Bulk Imports by Month
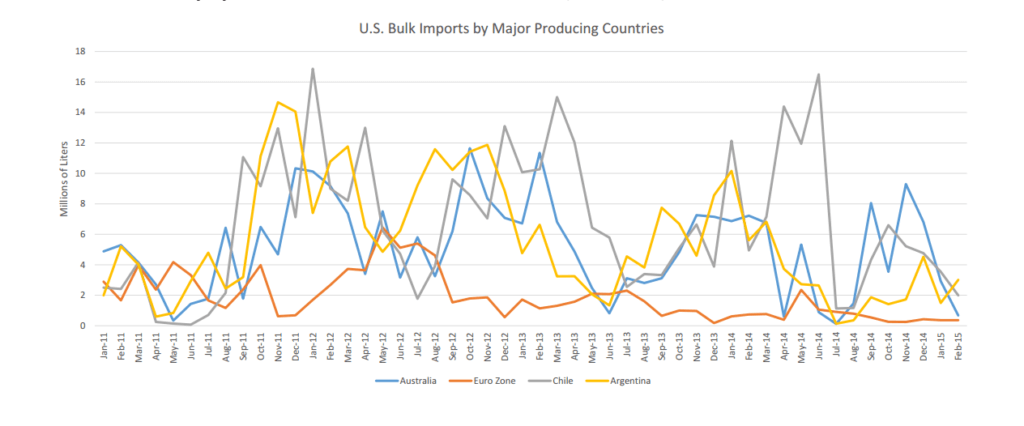
Chile, Argentina, and Australia are the major bulk suppliers to the U.S. (87%)
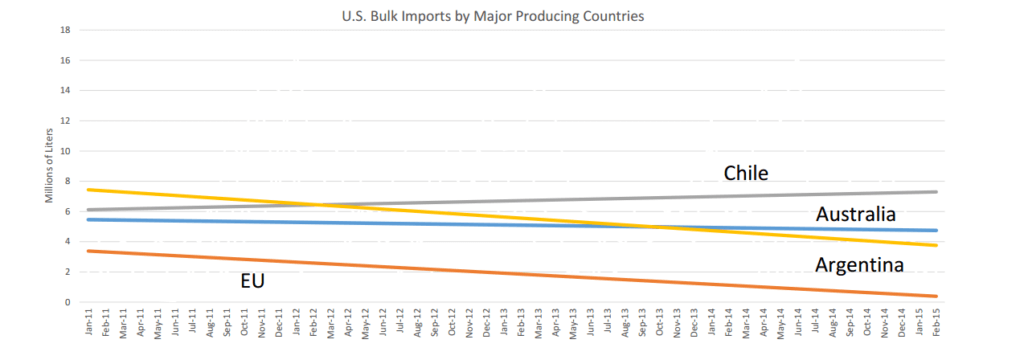
Chile, Argentina, and Australia Bulk Imports as Trendlines
Changes in Bulk Wine Quantities and Price (dollars/liter) from 2011-2014

Thoughts on Bulk Imports and Theory?
- Bulk imports did increase in 2012 for all countries but then declined in volume the following two years
- However Chilean and Australian prices fell in U.S. dollars by 18% and 19% and these two countries accounted for more than 50% of bulk shipments.
- Argentine bulk prices in U.S. dollars per liter remained roughly constant, but volumes declined by 60% from 2012 high. Not competitive with Chile and Australia?
Despite a strong dollar, volumes of U.S. bulk shipments have remained fairly constant
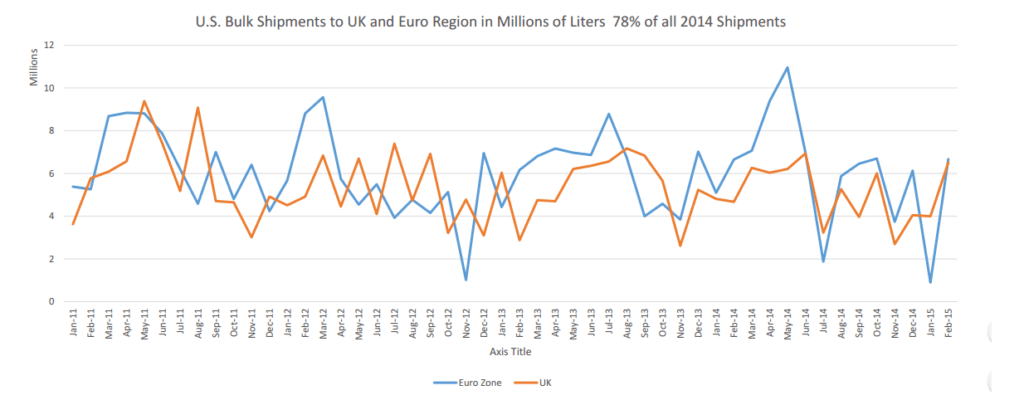
What Was Happening in the U.S.?
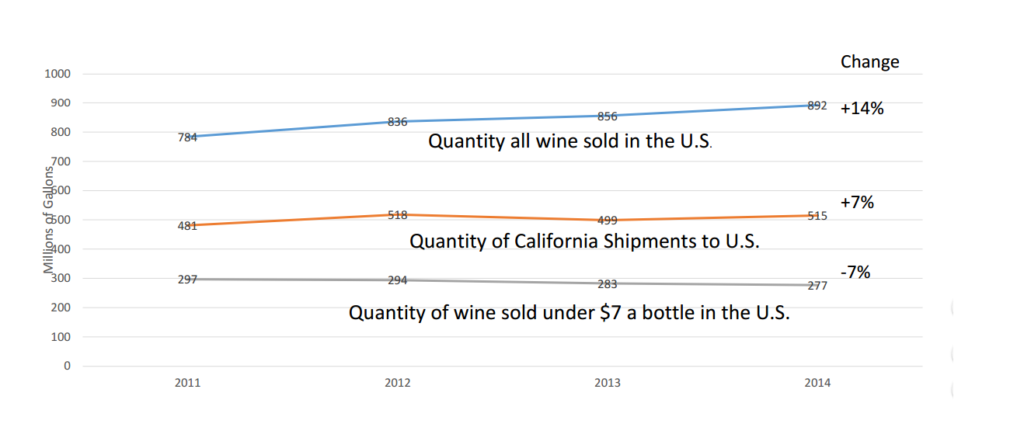
- Domestic quantity demanded has been increasing (2-4% per year) • Quantity demanded wine under $7 a bottle has decreased by 7% from 2011 to 2014
- Short vintages in 2010 and 2011. CA supply did not keep up with U.S. demand.
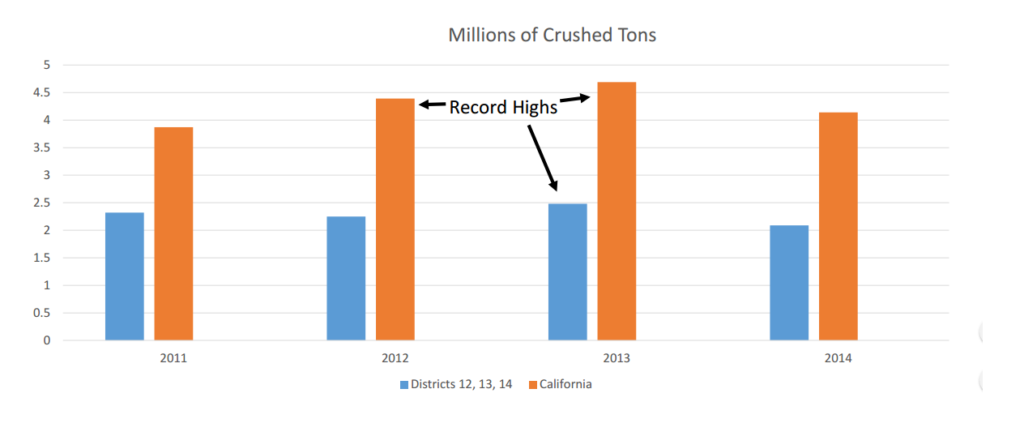
- This led to increased bulk imports in 2012, accounting for the spike • 2012 and 2013 were two record harvests in California
- Southern S.J Valley harvest produced a record 2.48 million tons in 2013, filling tanks and reducing the need for bulk wine imports
- All this affected California prices and import volumes
Quantity Demanded and California Shipments
Recent California Grape Crush
The drawback, if a factor, encouraged exports (and would tend to raise grape prices)
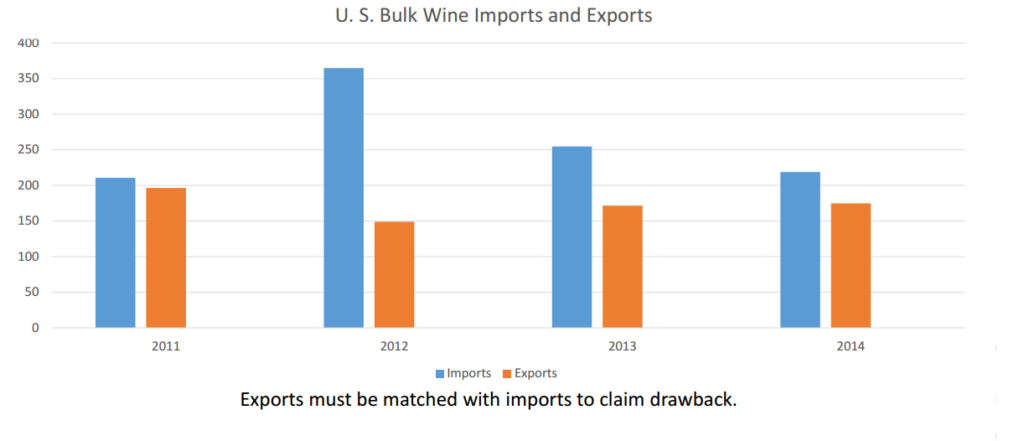
Conclusion?
- Exchange rates are one of several factors that affect grape prices.
- A strong dollar makes imports more competitive with domestic wine, thus lowering grape prices in California (at least for those segments where imports are a substitute)
- But decreasing U. S. demand for inexpensive wine coupled with large CA harvests also reduces CA prices (supply/demand)
- We live in a global marketplace. The two strategies for success are: (1) Differentiation (i.e. reduce the potential for substitution)(2) Increased efficiency (out-compete foreign producers)
Source: https://aic.ucdavis.edu/publications/CAWGLapsley2015.pdf
If you're a bulk wine or bulk spirits supplier, contract bottler, or private label producer aiming to connect with serious trade buyers, IBWSS San Francisco is the event you can't afford to miss. Get a quotation or Book a exhibitor table.

